Sendible insights 14 Essential Instagram Metrics You Need to Track in 2025
A successful social media strategy requires paying attention to content performance. This helps you know what engages your audience and tells you when to adjust your strategy.
Whether your client is a business aiming to demonstrate ROI, an influencer seeking audience insights, or a content creator honing their strategy, tracking Instagram metrics is your compass to helping your client succeed.
Knowing where to start with Instagram analytics can be confusing. That’s why we’ve created this handy guide. In it, we’ll cover:
- What are Instagram metrics?
- Why should you track Instagram metrics?
- How do you find and view your Instagram analytics?
- 14 Instagram metrics you need to track
What are Instagram metrics?
Instagram metrics refer to the various quantitative measurements and data points that reveal the effectiveness of your Instagram content.
These metrics provide insights into Instagram activities' engagement, reach, and impact.
Rather than only counting likes and shares, Instagram metrics dive into specific details, revealing crucial information such as the number of people who viewed and interacted with your content.
As we delve deeper into this guide, we'll explore critical social metrics, focusing on essential Instagram measurements like impressions, reach, and follower growth.
Why should you track Instagram metrics?
Tracking Instagram metrics has become a non-negotiable practice for anyone looking to make a significant impact with their marketing strategy.
Beyond the vanity metrics of likes and follows, delving into the depth of Instagram analytics offers many benefits that can elevate your social media strategy to new heights.
Here are five quick reasons to track Instagram metrics.
1. Instagram metrics show you how well your content performs
At its core, tracking Instagram metrics is akin to a performance review of your content. It allows you to assess the effectiveness of your posts, campaigns, and engagement strategies.
When you are creating your Instagram strategy, knowing which Instagram stories and reels will perform best is helpful in aligning your content creation with your goals.
Understanding what works and what doesn't is the first step towards refining your content strategy for optimal results.
2. Instagram metrics let you know what your audience likes
Instagram metrics provide invaluable insights into your target audience's behaviour and preferences.
As a social media marketer, it can be hard to simply know what your audience wants. Honestly, even if you did know, social media is so ever-changing that what your audience wants today is not the same as what they may want tomorrow.
By analysing metrics such as reach, impressions, and engagement rates, you understand when your audience is most active, the type of content they find appealing, and the factors that drive meaningful interactions.
This will allow you to focus our efforts on what works best with your Instagram stories and Instagram posts and resonates best with your target audience.

5 Steps to Define and Reach Your Social Media Target Audience.
3. Instagram metrics help you optimise your strategy
Armed with data on the performance of individual posts, you can fine-tune your content strategy.
Identify high-performing content and replicate its success while learning from underperforming posts to avoid pitfalls.
If there was a specific campaign or a category of content, be sure to tap into that as a content resource. This iterative process ensures continuous improvement, helping you set the right KPIs.

Quick Guide to Creating and Optimising an Instagram Business Profile
4. Instagram metrics demonstrate ROI
For businesses and influencers, tracking Instagram metrics is crucial for demonstrating return on investment (ROI).
Metrics such as sales, conversions, and click-through rates provide concrete evidence of how Instagram contributes to your bottom line, making it easier to justify your social media efforts to stakeholders.
5. Instagram metrics help you adapt to algorithm changes
Instagram's algorithms are not static and can significantly impact content visibility.
Regularly tracking metrics helps you adapt to algorithm changes by understanding how your content aligns with the platform's priorities. Stay flexible and adjust your strategy to maintain consistent visibility.
How do you find and view your Instagram analytics?
To access insights and metrics on Instagram, you must have an Instagram business or creator account.
There are two methods to view your metrics via the mobile app. (Note: these features are unavailable on desktop).
First, click the hamburger menu icon in the top right corner of your profile. Then tap "Insights" to access them directly.
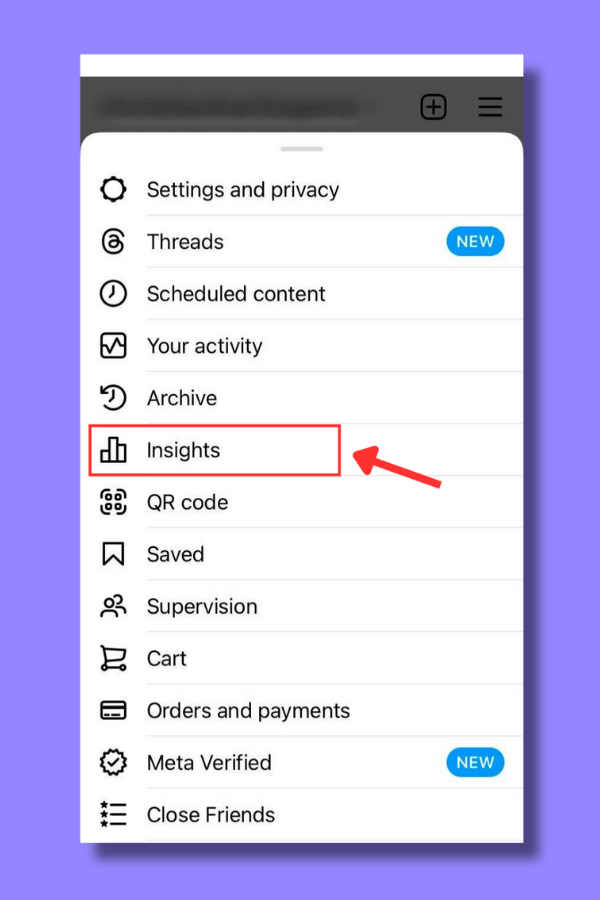
A second option is to navigate to your profile and tap the Professional Dashboard button. Then, tap "See all" for a detailed overview of your Instagram metrics.
While Instagram Insights provides essential metrics, consider leveraging third-party analytics tools like Sendible’s reporting hub to keep all of your reporting in one place, produce quick engagement reports, or even customise them and send them automatically to your clients.
Short on time? Sendible now allows users to create one-click reports that give users a quick overview of their social channels without diving too deep into the analytics.
This is perfect for a quick weekly check-in while a full dive into analytic reports could be left for the quarterly check-ins.
14 Instagram metrics you need to track performance
Here are 14 Instagram metrics to track to help measure how well your content performs.
1. Reach
Reach is a paramount metric to track. This metric reveals the number of unique accounts that have seen your post, providing a tangible measure of the awareness and value your brand is cultivating.
If your client’s goal is to increase their brand recognition, engage in social listening, and have the broadest audience possible, prioritising the growth of your reach on Instagram becomes essential.
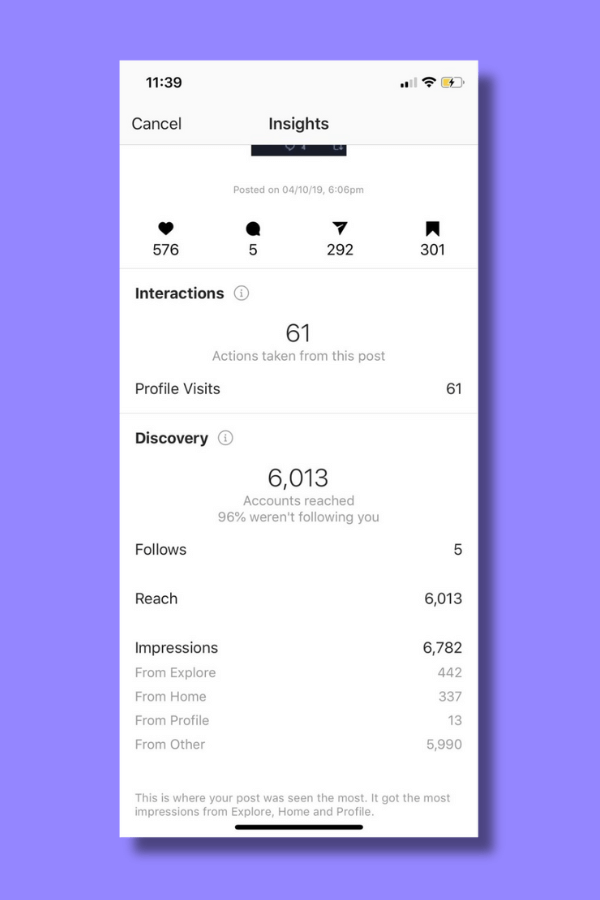 Source: Quora
When a post attains a higher or lower reach than usual, it becomes a valuable source of insights for future content strategies.
Consider your choice of hashtags, optimisation of your call-to-action (CTA) for engagement, strategic timing for publication based on audience activity, and any variations in the content type shared.
These factors directly influence a post's reach, making it imperative to observe and adapt to changes that could impact your metrics positively or negatively.
2. Impressions
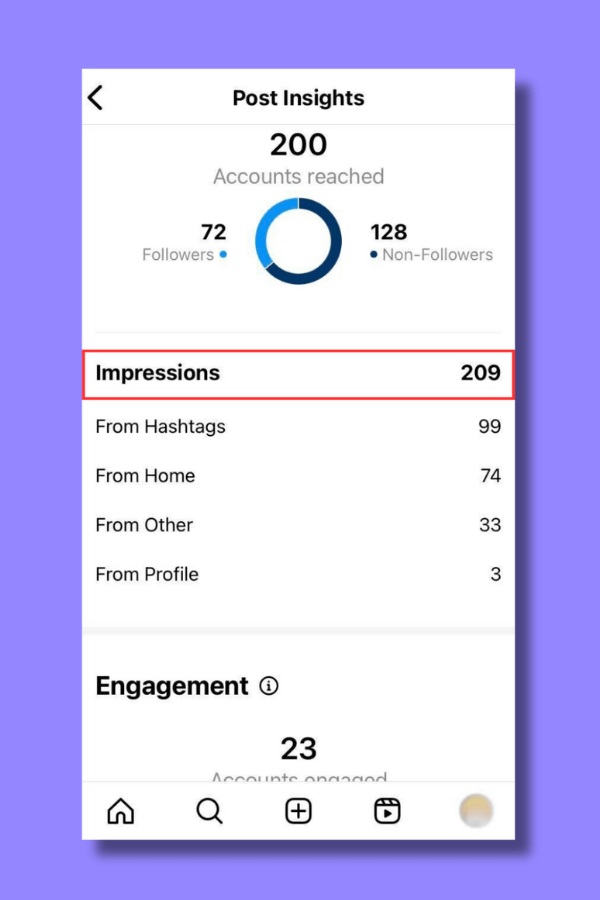
The impressions metric on Instagram refers to the number of times a particular piece of content (such as a post or a story) has been displayed on a user's screen.
It includes the times the content is shown to users in their feeds and when it appears on the Explore page, hashtags, or other discovery channels.
In simpler terms, impressions represent the reach of your content. If one user sees a post multiple times, each view counts as a separate impression.
This metric is valuable for assessing the visibility and exposure of your content to your audience.
Remember that impressions reflect how often the content has been viewed. Consider other metrics such as likes, comments, shares, and engagement rates for a more comprehensive analysis. We’ll get to those in a bit.
3. CTR
CTR (click-through rate) is a metric that measures the ratio of clicks on a specific link or call-to-action (CTA) to the total number of impressions (views) of that link or CTA.
It is expressed as a percentage and is used to evaluate the effectiveness of a particular campaign or piece of content in encouraging users to take the desired action.
The formula for calculating CTR is (Number of Clicks / Number of Impressions) x 100.
For Instagram, you might calculate CTR for various elements, such as:
- Links in Bio: The CTR would measure the percentage of users who click on the link in your Instagram bio out of the total number of people who view your profile.
- Swipe-Up links in stories: If you have the swipe-up feature in Instagram Stories, you can measure the CTR to see how many viewers clicked on the link in your story out of the total number of people who saw the story.
- Ad campaigns: For sponsored posts or advertisements, CTR helps assess how well the ad is performing in terms of driving user engagement.
A higher CTR is generally considered favourable and indicates that many users who saw your content took the next step and clicked on the link or CTA.
It implies that your content resonates with your audience and compels them to take action.
4. Sales
Instagram offers many features to facilitate brand-driven sales. These range from seamlessly integrated product tagging to shopping experiences led by creators. For businesses, monitoring sales metrics is crucial for achieving success.
Utilising Instagram's built-in shopping features provides access to vital sales metrics like product page views and actual sales if Instagram Checkout is enabled.
These metrics can be easily accessed within your Instagram Insights.
Beyond Instagram's native e-commerce tools, numerous brands boost sales by guiding users to explore the link in their bio for shopping opportunities. Consider adding this if it makes sense for your client
5. Engagement rate
Engagement rate is a crucial metric on Instagram that measures the level of interaction and involvement your content receives from your audience.
It is an indicator of how well your content resonates with your followers and provides insights into the effectiveness of your Instagram strategy.
When Instagram users comment, like, and interact with your Instagram stories and posts, that means that they are successfully engaging with your brand.
Engagement rate is typically expressed as a percentage and is calculated based on various forms of user interaction with your content.
The average engagement rate on Instagram is around 3-5%, depending on which research you find.
To find your Instagram engagement rate, take the total number of engagements on your account (likes, comments, shares, reposts, etc.) and divide it by your total number of followers. Multiply that number by 100 to get a percentage. That’s your “engagement rate.”
6. Best time to post
Discovering the optimal time to share your content is a smart strategy for connecting with your audience when they are most active and likely to engage.
Avoiding posting when your audience might be half-asleep or preoccupied with other matters can significantly enhance your content's visibility and impact.
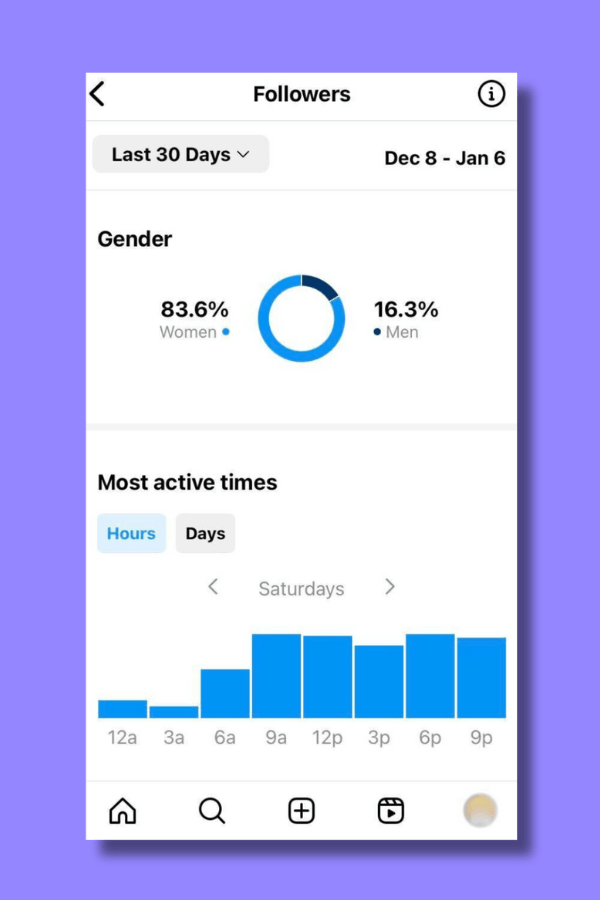
We've written the best time to post on social media if you're unsure where to begin. Instagram Insights also shows you when your followers are most active.
Head to your Professional Dashboard, then tap on “Total Followers.” Scroll all the way to the bottom, and you’ll find out when your followers are most likely to be on the app.
If you're aiming for a more personalised approach to determine your unique best posting times, we've got you covered. Sendible’s publishing solution simplifies the entire process, handling the heavy lifting for you.
Sendible's optimal time feature will also make sure you know the exact time to post so that your posts receive the most engagement possible on Instagram
7. Growth
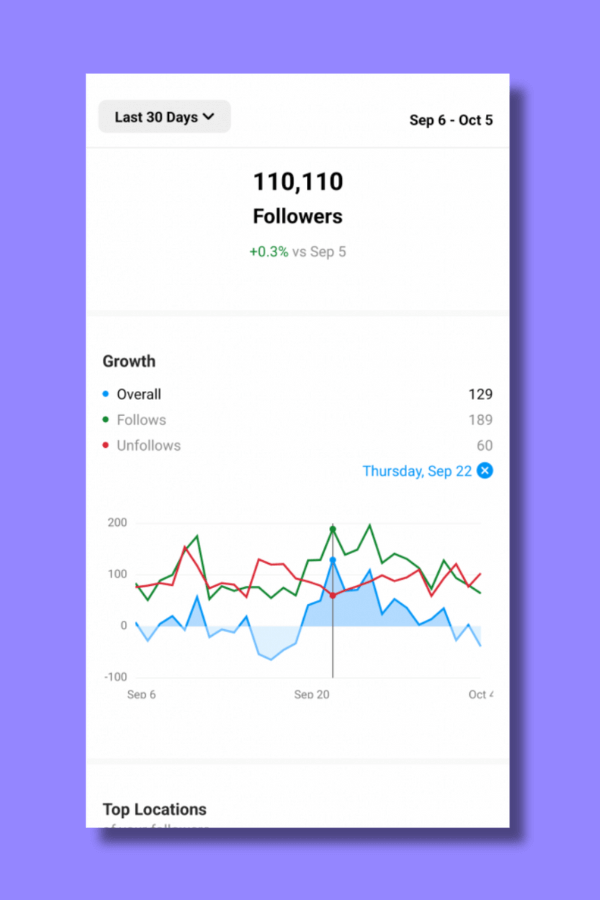
Keeping track of your profile's growth has always been vital. Thanks to Instagram's "followed" and "unfollowed" metrics, you can precisely monitor the daily ebb and flow of your follower count.
This detailed insight proves valuable in discerning which content contributes to Instagram follower growth and identifying the types of content that might lead to a wave of unfollows.
For instance, if you observe a surge in unfollows following one of your Stories, it serves as a clear signal that the content may not have resonated well with your audience.
 Source: Trend Hero
Remember that fluctuations are natural and can occur for various reasons. In the grand scheme, having a smaller but highly engaged audience often holds more significance than thousands of empty followers.
An engaged audience is more likely to champion your brand, make purchases, provide valuable feedback, and share your posts with their network of friends and family.
Focus on cultivating a dedicated and interactive community rather than chasing numbers. This is a surefire recipe for your brand's Instagram success.

How to Get More Followers on Instagram: 26 Strategies for Social Media Managers.
8. Traffic
When we talk about measuring traffic on Instagram, we mean outbound traffic from Instagram. If you have a link in your bio, like your website, e-commerce store, or Linktree (or similar tool), then you want to know how many people click that after a post, story, or reel.
This is helpful for finding out if the content you are creating is leading prospects down the sales funnel so they will purchase something from your brand
To find this, tap “View insights” on your post and scroll down to the “Profile activity” section.
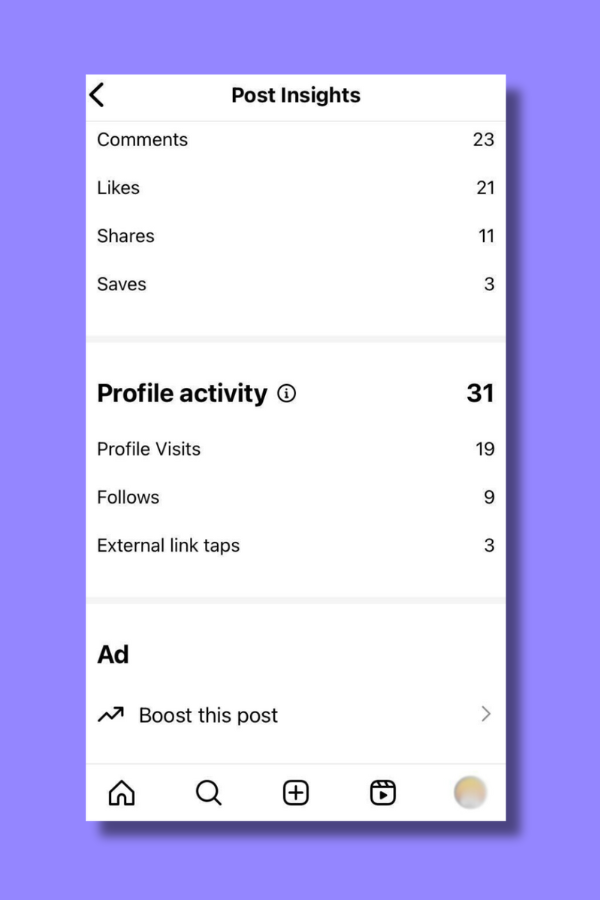
This will help you understand how much traffic your content creates and what content motivates followers to click.
Pay close attention so that you can adjust your content strategy to align with what followers want.
9. Saves
Saves are a critical Instagram metric you can watch. Users can easily collect and save a post for later by tapping the "bookmark" icon in the bottom right corner of an Instagram post.

By keeping track of the saves your posts accumulate, you gain insights into the content that resonates most with your audience. This knowledge can be valuable in shaping your future content strategy.
Want to boost your saves? Evergreen content is most likely to be bookmarked. Motivational quotes, carousel posts with tips, or educational resources are the types of content followers like to save.
10. Instagram Stories views
Instagram Stories build strong audience connections. Track view count taps forward and back to gauge your audience's response.
Each story slide has metrics like replies, impressions, and navigations (i.e. do they tap forward, backwards, or exit).
Analysing these metrics reveals audience interests and engagement patterns.
Your Instagram Stories “Watch Through Rate” indicates the percentage of people who followed your stories from start to finish.
Here’s the simple formula to calculate this: Watch through rate = Final story views / First story views x 100.
This will give you the percentage of how many followers watched through to the end of your story. Remember, this only works if you have more than one story slide.
You can also check your “Slide Completion Rate” metric. This gauges the percentage of viewers who watch a slide in its entirety without clicking away within the first second.
To calculate it, use this formula: Completion rate = (Number of impressions - Number of exits) / Impressions.
11. Instagram Reels engagement rate through Instagram Insights
Instagram Reels are one of the best ways your client can expand their brand. More eyeballs are on Reels than anything else on Instagram. This should come as no surprise since it's quite easy to watch reel after reel on your Instagram account.
Instagram Insights is a recent addition to Reels. Like in a post, you can access metrics like comments, likes, saves, reach, plays, and interactions. Reel interactions reveal the unique viewers, while plays indicate how often the Reel was played.
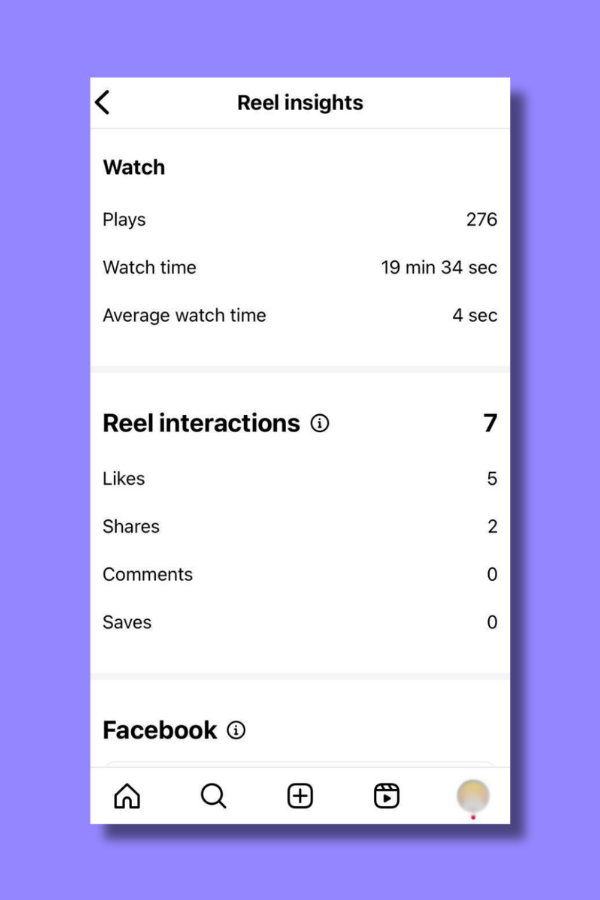
To find your engagement rate, use this formula: (Number of Reels interactions / Reels Plays) x 100.
This metric is valuable for assessing the effectiveness of Reel content and increasing brand awareness.
Your engagement rate goal will vary by the number of followers you have.
12. Average watch time
The average watch time metric on Instagram shows when followers stop watching at a certain point.
A low average watch time could indicate that the content at that point no longer resonates with the audience.
To find this, go to “View Insights” underneath your reel. Scroll down to “Reel Interactions.” First, you’ll see “Watch time,” which is the total time your reel was played, including any time spent replaying the reel. Right under that, you’ll find “Average watch time.”
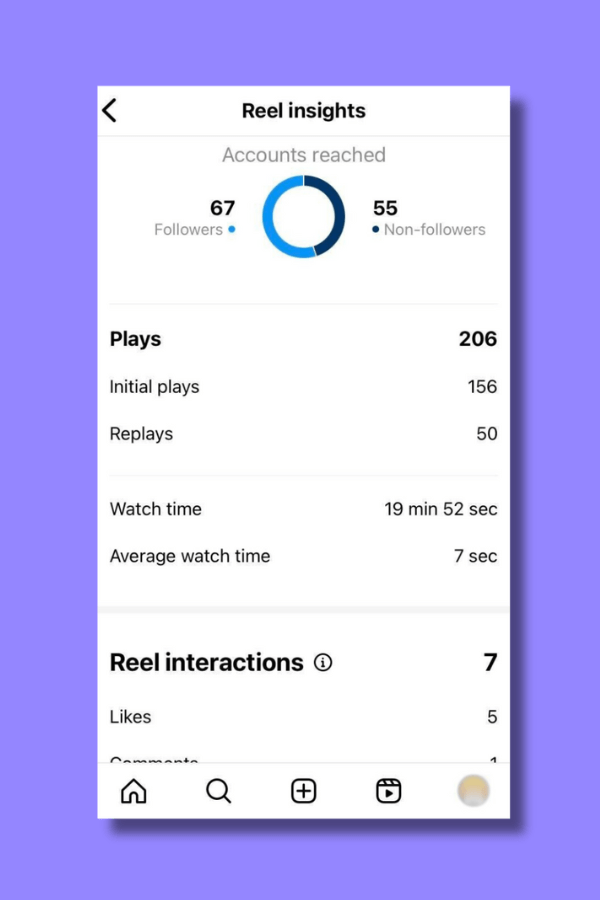
By monitoring this metric, you’ll be able to identify precisely where viewers disengage. This information is invaluable for optimising video content.
Understanding the audience's preferences and behaviours enables you to make informed decisions about video length, content structure, and the placement of key elements to keep viewers engaged throughout the video.
13. Comments
This one is self-explanatory. Tracking comments on Instagram is vital as they reflect direct user engagement. Comments provide insights into audience sentiments, preferences, and feedback.
Monitoring comments allows your client’s brand to foster community interaction, respond to queries, and adapt content strategies based on real-time audience interaction. More comments can enhance brand perception and engagement.
14. Shares
Like comments, measuring shares is fundamental but beneficial nonetheless.
Tracking shares helps you discover content resonance and amplification. When users share content, it expands reach, potentially attracting new audiences.
Analysing shares provides valuable insights into audience preferences, allowing brands to refine their content strategy and leverage user-generated advocacy for increased visibility and engagement.
Wrapping it up
Navigating the realm of Instagram analytics may seem daunting. But it doesn’t have to be. Now that you know 14 key Instagram metrics, you can start tracking and reporting to your clients.
Level up your Instagram metrics with Sendible's Reporting Hub. Experience the ease of automated reports and one-click engagement insights and effortlessly send these reports to your clients. Start your free trial today.
Freya Laskowski
Freya is an SEO consultant that helps brands scale their organic traffic with content creation and distribution. She is a quoted contributor in several online publications, including Business Insider, Fox Business, Yahoo Finance, and the Huffington Post. She also owns CollectingCents- a personal finance blog that she grew from the ground up.
You can reach out to her at freya@collectingcents.com
Text copied!


